Often when we are creating a dashboard we reach the limits of what the Studio can do. We then use the Code Editor to create custom charts.
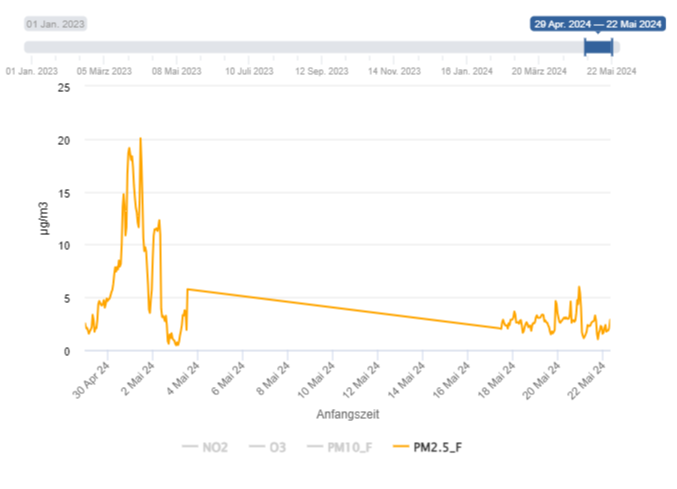
The Code Editor gives us more freedom in creating charts, however what options are available to style the charts is a bit hit and miss. It would be great if we could use all the configuration options of Highcharts to style the Chart Widget. At the moment we are e.g. missing the connectNulls option for line series where there are caps in the data or the dataSorting configuration when we want to arrange the data after getting it from the context.
If it is too much work to incorporate all configuration options it would still be great to have a way to “pipe through” the Highcharts configuration somehow.
Auto-translation 🪄
Souvent, lorsque nous créons un tableau de bord, nous atteignons les limites de ce que le Studio peut faire. Nous utilisons ensuite l'éditeur de code pour créer des graphiques personnalisés. L'éditeur de code nous donne plus de liberté dans la création de graphiques, mais les options disponibles pour styliser les graphiques sont un peu aléatoires. Ce serait formidable si nous pouvions utiliser toutes les options de configuration de Highcharts pour styliser le widget graphique. En ce moment, nous sommes par ex. il manque l'option connectNulls pour les séries de lignes où il y a des majuscules dans les données ou la configuration dataSorting lorsque nous voulons organiser les données après les avoir extraites du contexte. Si cela demande trop de travail d'incorporer toutes les options de configuration, ce serait quand même génial d'avoir un moyen de « traverser » la configuration Highcharts d'une manière ou d'une autre.