

Hello,
I am trying to change the thickness of the line in one of my ods-charts. I saw in the documentation that I can use a custom css library to change the formatting (ods-chart: Custom CSS Library – Codelibrary).
I added the class="large-chart-series" to my ods-chart and it worked well when I was running the website locally.
However when I try to implement the changes in the code editor on the ODS portal I am getting an API error:
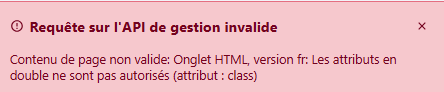
Is using the custom css library depreciated?
What else can I do do change the format of my charts?
Below I am pasting the code for the ods-chart I was working on.
Thanks for the help
        <ods-chart class="large-chart-series"
            single-y-axis="true"
            single-y-axis-label=""
            display-legend="true"
            label-x=""
            scientific-display="false"
            align-month="true"
            class="no-bg"
        >
            <ods-chart-query
                context="eolienperiodique"
                field-x="timestamp"
                maxpoints="0"
                timescale="day"
            >
                <ods-chart-serie
                    expression-y="productible"
                    multiplier="0.08111"
                    chart-type="column"
                    function-y="SUM"
                    label-y=""
                    color="#376092"
                    display-values="false"
                    display-stack-values="false"
                    scientific-display="false"
                >
                </ods-chart-serie>
                <ods-chart-serie
                    expression-y="432"
                    chart-type="spline"
                    function-y="CONSTANT"
                    label-y=""
                    color="#64cc41"
                    scientific-display="false"
                >
                </ods-chart-serie>
                <ods-chart-serie
                    expression-y="6256"
                    chart-type="line"
                    function-y="CONSTANT"
                    label-y=""
                    color="#e3be2b"
                    display-units="false"
                    scientific-display="true"
                >
                </ods-chart-serie>
            </ods-chart-query>
        </ods-chart>