

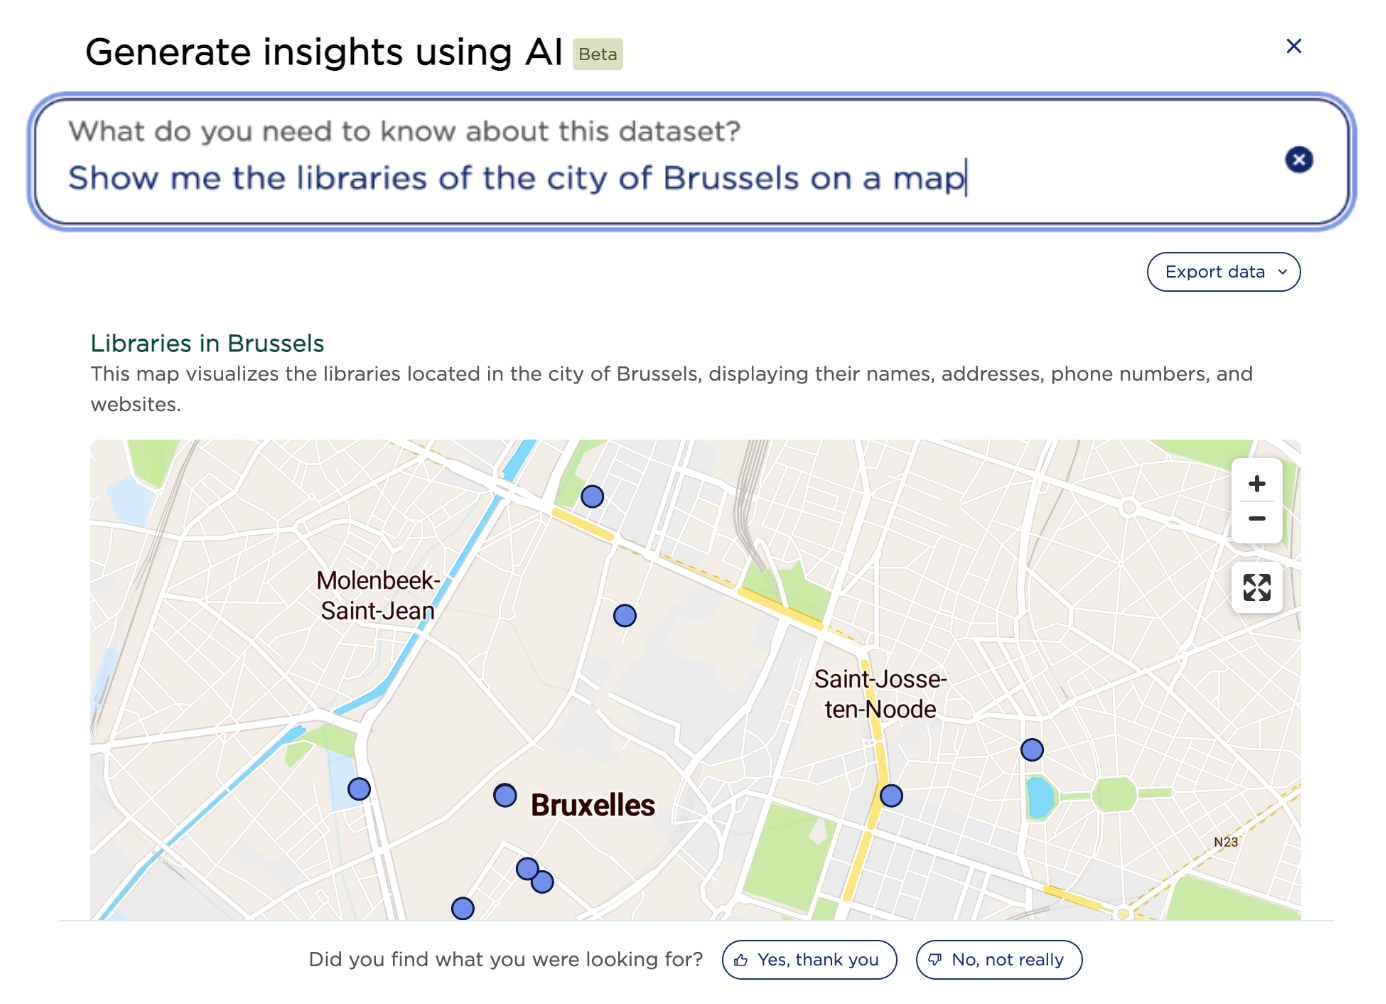
What if your users had a data visualization expert by their side, ready to help them quickly create their maps and charts? 👀
That’s what our new feature provides, meaning generating data visualizations has never been easier. Users just ask a question, and the AI handles the rest!
Available to all users registered on your portal, "Explore Data with AI" provides an interactive tool to easily explore, transform, and reuse raw data independently.
Revolutionize the way your users explore your datasets, delivering multiple benefits
- Range of available visualizations: Create a variety of formats, including maps, charts, and graphs, all tailored to the user’s specific request.
- Multiple export formats: Easily reuse visualizations through export formats such as PNG, CSV, and API Explore requests.
- Expand your audience: Once activated, the feature is available to all registered users on your portal, encouraging new users to sign up.
- Train on AI: Help your users understand and master AI-powered features, with the tool providing clear explanations for each visualization, backed up with dedicated documentation
Activation required
To activate this feature, simply contact your Customer Success Manager, your sales representative, or Opendatasoft support, and make the most of it for free until the end of the year.
To learn more
- Check out the dedicated documentation
- Test the feature on our Data Hub, or on one of our customer portals by accessing a dataset and clicking the “Explore Data with AI” button, located at the top right.
Auto-translation 🪄
Et si vos utilisateurs avaient un expert en visualisation de données à leurs côtés, prêt à les aider à créer rapidement leurs cartes et graphiques ? 👀C'est ce que propose notre nouvelle fonctionnalité, ce qui signifie que générer des visualisations de données n'a jamais été aussi simple. Les utilisateurs posent simplement une question, et l'IA s'occupe du reste ! Disponible pour tous les utilisateurs enregistrés sur votre portail, « Explore Data with AI » fournit un outil interactif pour explorer, transformer et réutiliser facilement les données brutes de manière indépendante. Révolutionnez la façon dont vos utilisateurs explorent vos ensembles de données, offrant de multiples avantages Gamme de visualisations disponibles : créez une variété de formats, y compris des cartes, des diagrammes et des graphiques, tous adaptés à la demande spécifique de l'utilisateur. Plusieurs formats d'exportation : réutilisez facilement les visualisations via des formats d'exportation tels que PNG, CSV et les requêtes API Explore. Élargissez votre audience : une fois activée, la fonctionnalité est disponible pour tous les utilisateurs enregistrés sur votre portail, ce qui encourage les nouveaux utilisateurs à s'inscrire. Formez-vous à l'IA : aidez vos utilisateurs à comprendre et à maîtriser l'IA