Solved

choose the background colours and text showing in the tree map

  • September 24, 2024
  • 4 replies
  • 212 views
  • Translate

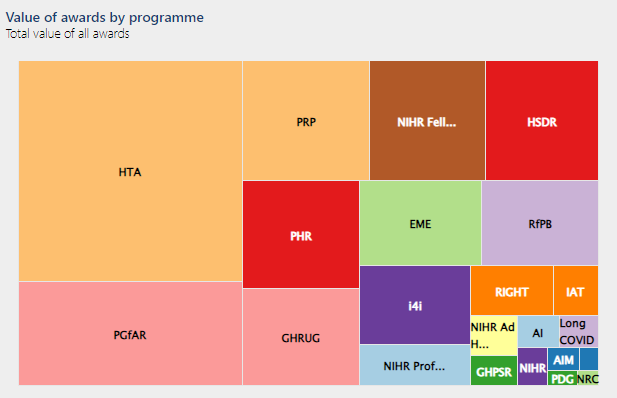
Hi, bit of a coding novice here. Can someone help with the code with choosing which background to select for each variable in my tree map/chart, as well as the text label to show on top. Would this be done in the HTML or CSS element fo the code? I ahve a screenshot of the tree chart below. Thanks!


Auto-translation 🪄

Bonjour, je suis un peu novice en codage ici. Quelqu'un peut-il m'aider avec le code pour choisir l'arrière-plan à sélectionner pour chaque variable dans ma carte/mon graphique en arborescence, ainsi que l'étiquette de texte à afficher en haut. Cela se ferait-il dans l'élément HTML ou CSS du code ? J'ai une capture d'écran du graphique en arborescence ci-dessous. Merci !

Best answer by Aubin

Hello, to choose precisely the color by label, you need to create an object in your page :
inside a balise with the parameter  ng-init create an object with : 
chartcolors={‘your_y_label’:’color_code’}

Then in the chart-query add category-colors="chartcolors"

here an exemple :

<ods-dataset-context context="lesarbresremarquables" lesarbresremarquables-dataset="les-arbres-remarquables"
                     ng-init="chartcolors={
              'Araucaria':'rgba(0, 103, 156, 1)',
              'Acer':'rgba(75, 158, 55, 1)',
              'Aesculus':'rgba(196, 24, 44, 1)',
              'Alnus':'rgba(37, 188, 225, 1)'
              };">
    <ods-chart scientific-display="false" align-month="true">
        <ods-chart-query context="lesarbresremarquables" field-x="arbres_genre" maxpoints="5" category-colors="chartcolors">
            <ods-chart-serie expression-y="arbres_idbase" chart-type="treemap" function-y="AVG"  scientific-display="true">
            </ods-chart-serie>
        </ods-chart-query>
    </ods-chart>

</ods-dataset-context>

I hope this will help you!

Auto-translation 🪄

Bonjour, pour choisir précisément la couleur par label, il faut créer un objet dans votre page :à l'intérieur d'une balise avec le paramètre ng-init créez un objet avec : chartcolors={‘your_y_label’:’color_code’}Puis dans la chart-query ajoutez category-colors="chartcolors"voici un exemple :                                              
View original

  • Seeker
  • September 24, 2024

that should have read the background colour to each variable. 

Auto-translation 🪄

cela aurait dû lire la couleur d'arrière-plan de chaque variable.
Translate

  • Guide
  • September 25, 2024

Hello, to choose precisely the color by label, you need to create an object in your page :
inside a balise with the parameter  ng-init create an object with : 
chartcolors={‘your_y_label’:’color_code’}

Then in the chart-query add category-colors="chartcolors"

here an exemple :

<ods-dataset-context context="lesarbresremarquables" lesarbresremarquables-dataset="les-arbres-remarquables"
                     ng-init="chartcolors={
              'Araucaria':'rgba(0, 103, 156, 1)',
              'Acer':'rgba(75, 158, 55, 1)',
              'Aesculus':'rgba(196, 24, 44, 1)',
              'Alnus':'rgba(37, 188, 225, 1)'
              };">
    <ods-chart scientific-display="false" align-month="true">
        <ods-chart-query context="lesarbresremarquables" field-x="arbres_genre" maxpoints="5" category-colors="chartcolors">
            <ods-chart-serie expression-y="arbres_idbase" chart-type="treemap" function-y="AVG"  scientific-display="true">
            </ods-chart-serie>
        </ods-chart-query>
    </ods-chart>

</ods-dataset-context>

I hope this will help you!

Auto-translation 🪄

Bonjour, pour choisir précisément la couleur par label, il faut créer un objet dans votre page :à l'intérieur d'une balise avec le paramètre ng-init créez un objet avec : chartcolors={‘your_y_label’:’color_code’}Puis dans la chart-query ajoutez category-colors="chartcolors"voici un exemple :                                              
Translate

  • Seeker
  • September 26, 2024

Thanks Aubin for coming back,


Currently our code reads as the below:

 <ods-chart single-y-axis="true" display-legend="false" >
                                    <ods-chart-query context="allawards" field-x="acronym" maxpoints="50">
                                        <ods-chart-serie expression-y="award_amount_from_dh"  label-y="Total value of awards £" chart-type="treemap" display-units="false" function-y="sum" color="range-Paired" scientific-display="true">
                                        </ods-chart-serie>
                                    </ods-chart-query>
                                </ods-chart>


I have tried implementing your suggestion but i am unable to get it to work. I believe the main issue is to do with the first line of code as I am not sure what this is referring to. I ahve rewritten my code as per your suggestion below, are you able to review it?


<ods-dataset-context context="allawards" allawards-parameters='disjunctive.programme'

ng-init="chartcolors={

'HTA':'#193E72',
‘PRP: '#6667AD'

};">
    <ods-chart scientific-display="false" align-month="true">
        <ods-chart-query context="allawards" field-x="acronym" maxpoints="50" category-colors="chartcolors">
            <ods-chart-serie expression-y="award_amount_from_dh" label-y="Total value of awards £"  chart-type="treemap" function-y="sum"  scientific-display="true">
            </ods-chart-serie>
        </ods-chart-query>
    </ods-chart>


To note, I ahve more colours to list but I wanted to check that it works with just these two first. 


Thanks,

Noel


Auto-translation 🪄

Merci Aubin pour ton retour, Actuellement notre code se lit comme suit :                                                                                                                                                                                                   J'ai essayé d'implémenter votre suggestion, mais je n'arrive pas à la faire fonctionner. Je pense que le problème principal concerne la première ligne de code, car je ne suis pas sûr de ce à quoi cela fait référence. J'ai réécrit mon code conformément à votre suggestion ci-dessous, pouvez-vous le consulter ? 
Translate

  • Guide
  • October 7, 2024

Hello Noel,

Indeed you were wright the problem is coming from your context, you are missing the parameter “dataset” where you need to wright the dataset-id of your dataset. By adding this it should work :) 
I would suggest you to follow this course from the academy to help you build a page in the code editor.

Best regards,

Aubin

Auto-translation 🪄

Bonjour Noel, En effet tu avais raison le problème vient de ton contexte, il te manque le paramètre « dataset » où tu dois écrire le dataset-id de ton dataset. En ajoutant cela ça devrait fonctionner :) Je te suggère de suivre ce cours de l'académie pour t'aider à construire une page dans l'éditeur de code. Cordialement, Aubin
Translate

Reply


Cookie policy

We use cookies to enhance and personalize your experience. If you accept you agree to our full cookie policy. Learn more about our cookies.

 
Cookie settings